


PUBLISHED -
April 21, 2026
Virtual Reality (VR) / Data Visualization

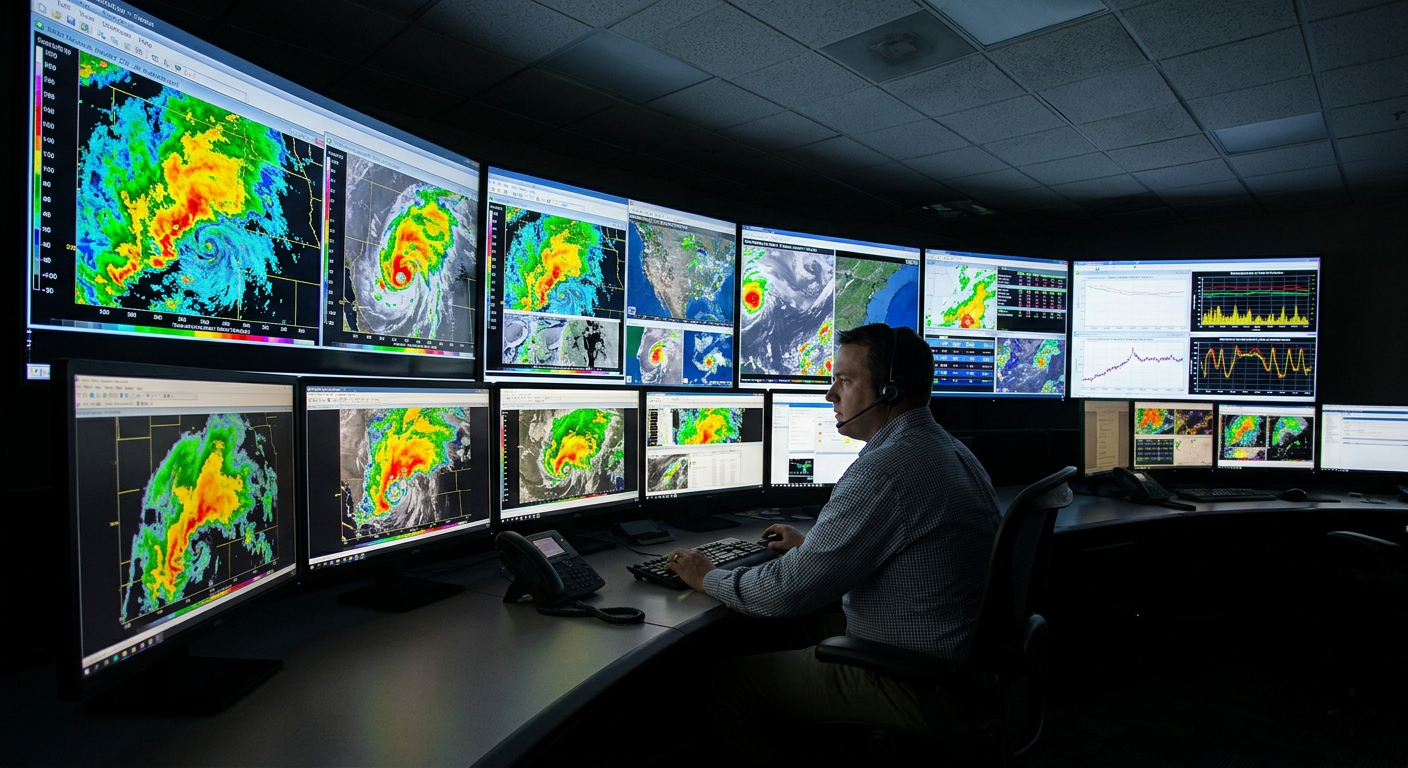

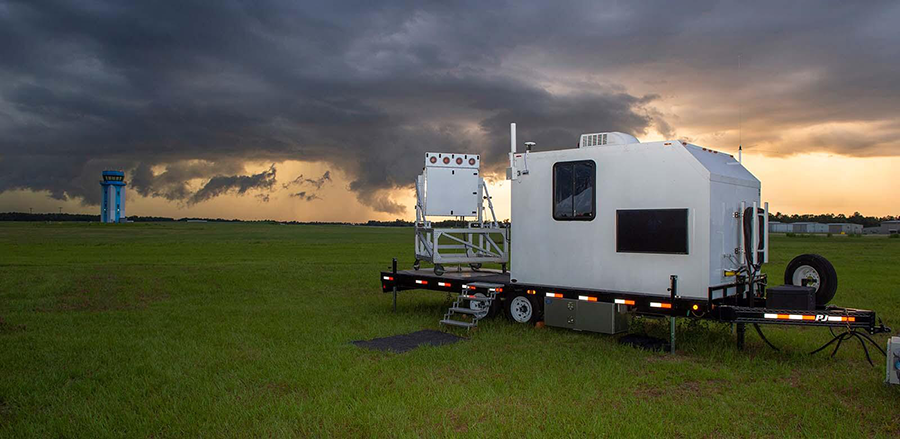
Our senior practitioners conducted deep-dive workshops with lead analysts to define the "North Star" metric: reducing the time from data ingestion to actionable insight. We identified that the primary bottleneck was the mental translation of 2D charts into 3D spatial models. Utilizing a human-centered design process, we interviewed weather analysts during high-pressure storm tracking. This research revealed a need for a "hands-on" approach to data—allowing analysts to literally step inside a hurricane or atmospheric front to identify anomalies invisible on standard monitors.
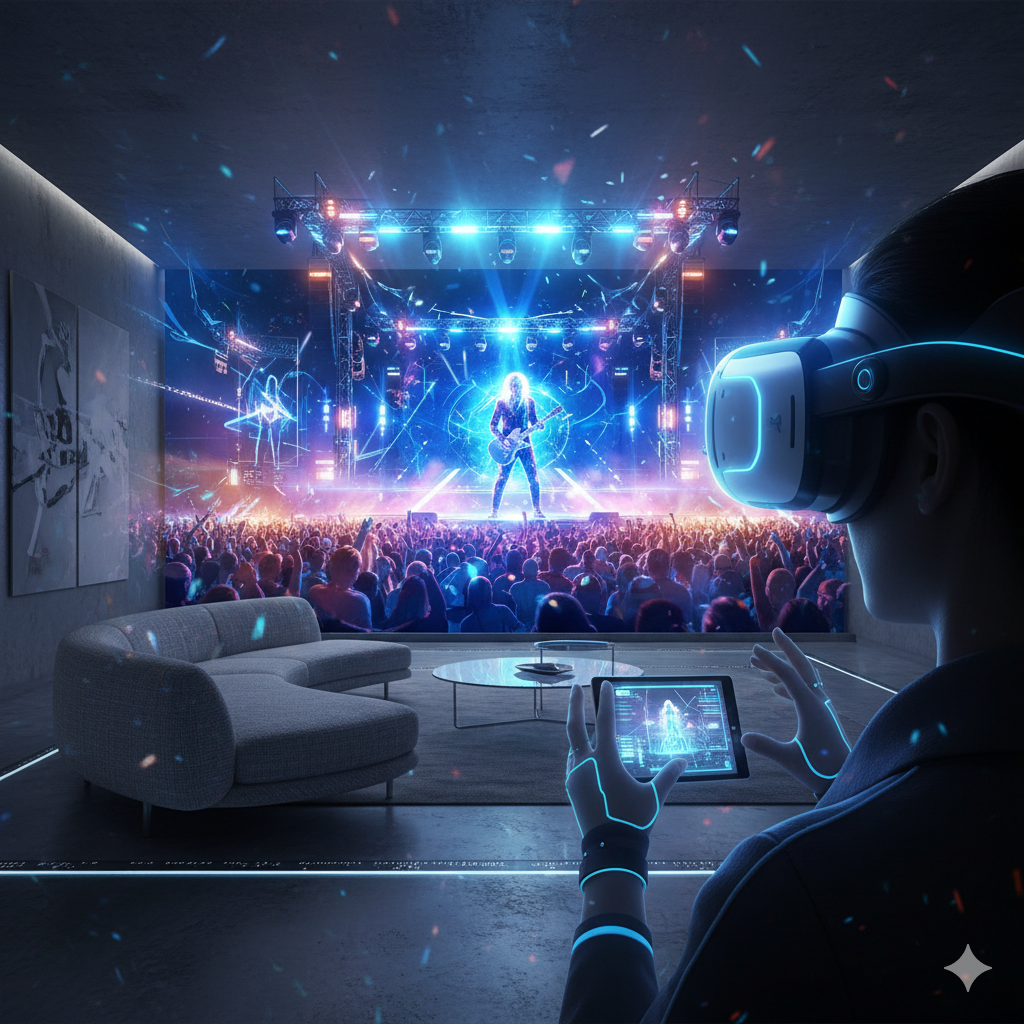
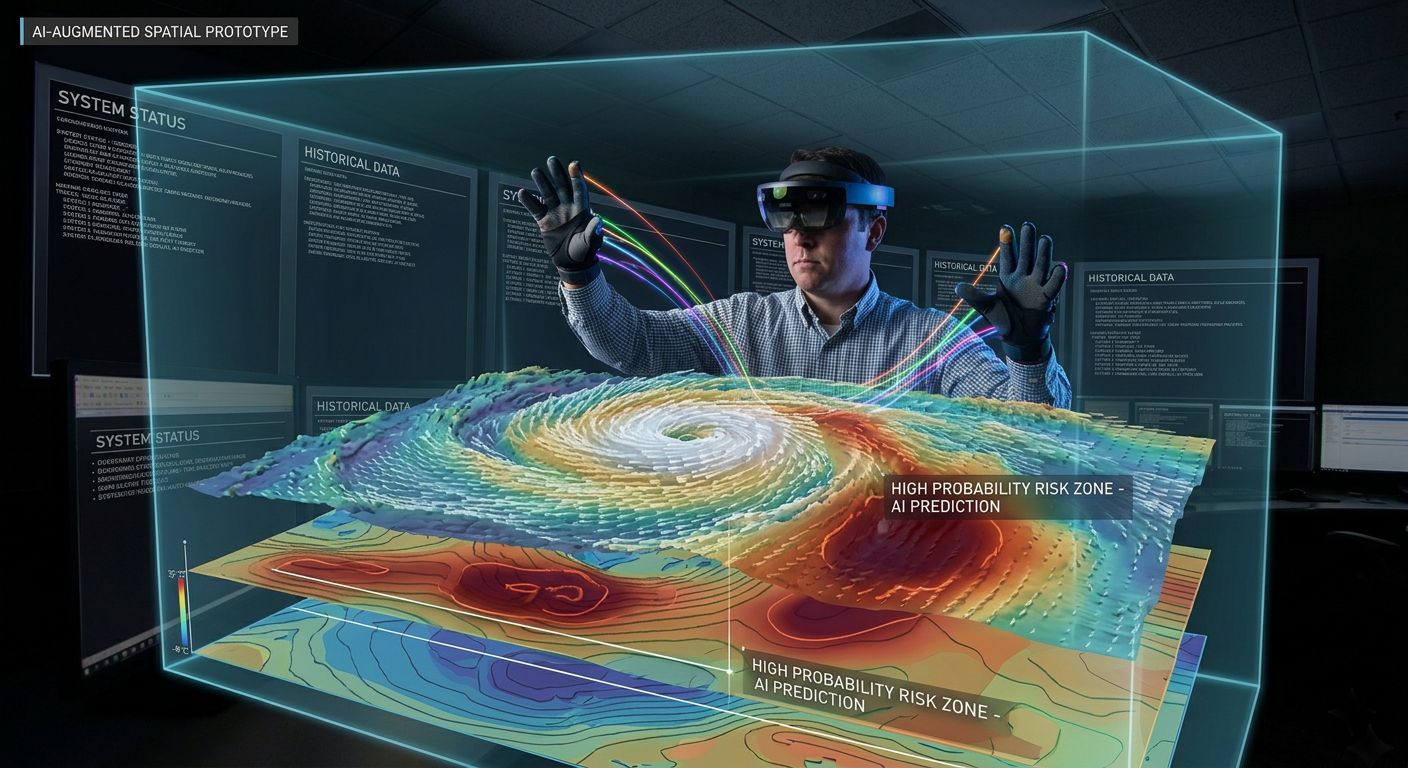
Leveraging our AI-augmented delivery capabilities, we rapidly prototyped an immersive spatial environment; Volumetric Visualization: Large-scale 3D models of weather systems, Gesture-Based Interaction: Analysts could "pull apart" atmospheric layers to inspect pressure gradients, AI Synthesis: Integrated AI layers that highlighted high-probability risk zones within the VR space.
Results
35% Reduction in Insight Latency: Analysts identified critical pattern shifts significantly faster than on 2D displays.
Enhanced Spatial Accuracy: Improved precision in localized precipitation forecasting by allowing analysts to visualize terrain-atmospheric interactions in 3D.
Competitive Advantage: The client secured a proprietary toolset that differentiates their service offering in a crowded meteorological market.
"By blending emerging technology with rigorous human-centered research, we didn't just build a VR tool; we redefined the weather analyst's cockpit for the next decade." — Senior Practitioner, Traverse Innovation
CREATE THE FUTURE, TODAY